
Openebs Jiva/Cstor Performance Timings
What sort of performance impact does Jiva replication have on drive performance in K8s? I wasn’t able to find any recent, quick numbers, so I did some quick and sloppy testing for myself and was shocked by the results…
Introdution
Jiva volumes with a replication factor of two saw an 83% drop in throughput capacity. Three volume replication was even worse, weighing in at an 87% drop in performance. In all fairness, I’m mostly living in the land of default options, but that much of a reduction in performance feels rather drastic.
The OpenEBS documentation seems to indirectly confirm this performance hit. The openebs docs for mayastor confirm this result.
By comparison, most pre-CAS shared everything storage systems are widely thought to impart an overhead of at least 40% and sometimes as much as 80% or more than the capabilities of the underlying devices or cloud volumes. Additionally, pre-CAS shared storage scales in an unpredictable manner as I/O from many workloads interact and complete for the capabilities of the shared storage system.
System Specs
The system here is your typical craptastic home lab that targets that sweet spot that we all know so well – a small pile o’ celerons with 16 Gigs of ram and a singe sata SSD.
- CPU
- 4 core Celeron J3455 1.50GHz
- Memory
- 16GB
- Hard Drive
- SSD SK 120GB (SATA 3.0)
- Linux Kernel
- 5.15.0-60
- Network Size
- 1 Gigabit
Testing Methodology
As already implied, these tests were not performed rigorously. The goal was to get a quick sense in relative peformance
For each test case I installed dbench and ran a
quick one minute test in each context with the command dbench 4 -t 60. For
replicated Jiva and /Cstor volumes, I created 10GB persistent volumes to run
dbench against. I also did some quick sanity checking to see if prewarming
replicated volumes, but did not see a substantial impact.
I was very surprised by how poorly cstor performed. Cstor performance, Despite having dedicated logical volumes (Jiva relies upon hostpath), performed worth with two replicas than Jiva with three.
Results
| Method | Throughput | Latency |
|---|---|---|
| Directly on K8s node | 492.324 MB/sec | 35.936 ms |
| Ephemeral Storage | 420.743 MB/sec | 30.604 ms |
| Jiva HostPath | 461.453 MB/sec | 36.419 ms |
| Jiva with two replicas | 80.6754 MB/sec | 578.915 ms |
| Jiva with three replicas | 61.2597 MB/sec | 710.717 ms |
| CStor with two replicas | 50.5629 MB/sec | 1134.019 ms |
Table Of Contents
After the fact I took a quick peek at prometheus and the bottleneck became quite clear. Those poor little gigabit interfaces are gasping under the load.
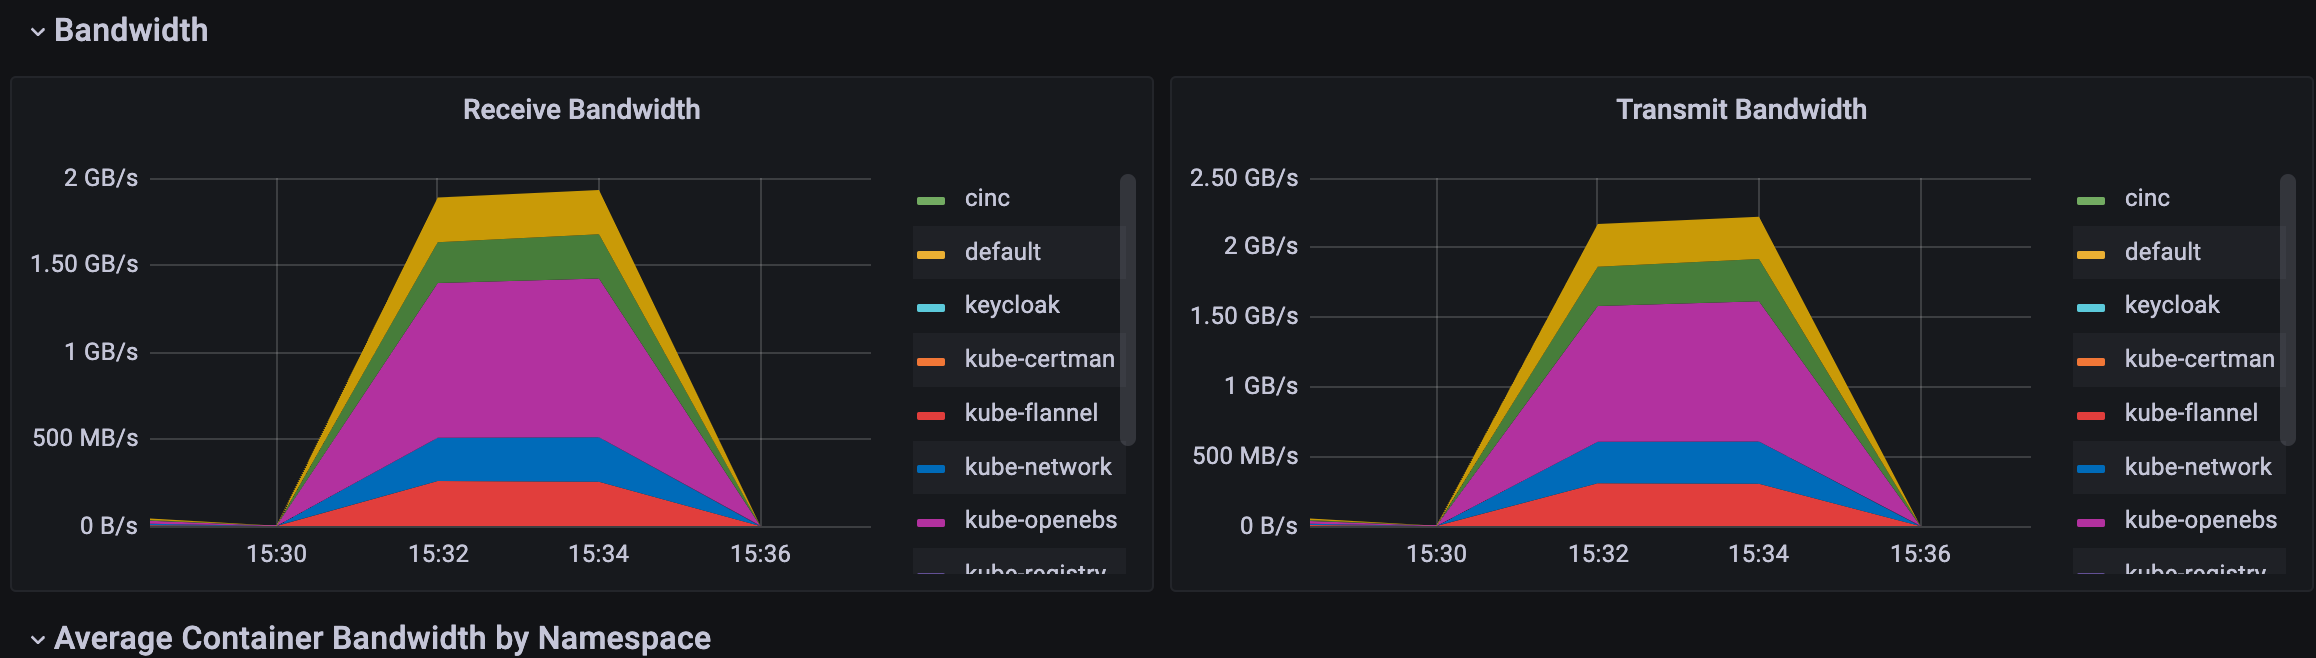
OpenEBSNetwork Load
The test data
Directly on the K8s node itself
#  Direct on k8s node
root@k8sn3:/home/jblack# dbench 4 -t 60
dbench version 4.00 - Copyright Andrew Tridgell 1999-2004

Running for 60 seconds with load '/usr/share/dbench/client.txt' and minimum warmup 12 secs
2 of 4 processes prepared for launch   0 sec
4 of 4 processes prepared for launch   0 sec
releasing clients
   4     21792   539.21 MB/sec  warmup   1 sec  latency 9.978 ms
   ...
   4   1610876   492.32 MB/sec  execute  59 sec  latency 5.818 ms
   4  cleanup  60 sec
   0  cleanup  60 sec

 Operation      Count    AvgLat    MaxLat
 ----------------------------------------
 NTCreateX     940362     0.031    13.741
 Close         690773     0.003    13.410
 Rename         39816     0.083    20.120
 Unlink        189895     0.074    11.930
 Deltree           24     6.234    13.473
 Mkdir             12     0.007     0.008
 Qpathinfo     852313     0.013    14.438
 Qfileinfo     149372     0.001     1.058
 Qfsinfo       156277     0.006     6.632
 Sfileinfo      76600     0.031     6.431
 Find          329527     0.045    10.178
 WriteX        468874     0.049    15.948
 ReadX        1474053     0.007     9.585
 LockX           3062     0.006     0.337
 UnlockX         3062     0.002     0.105
 Flush          65918     1.681    35.923

Throughput 492.324 MB/sec  4 clients  4 procs  max_latency=35.936 ms
Ephemeral storage
root@ubuntu-pv:/# dbench 4 -t 60 /
dbench version 4.00 - Copyright Andrew Tridgell 1999-2004

Running for 60 seconds with load '/usr/share/dbench/client.txt' and minimum warmup 12 secs
2 of 4 processes prepared for launch   0 sec
4 of 4 processes prepared for launch   0 sec
releasing clients
   4     17518   448.79 MB/sec  warmup   1 sec  latency 15.391 ms
   ...
   4   1375863   420.74 MB/sec  execute  59 sec  latency 17.729 ms
   4  cleanup  60 sec
   0  cleanup  60 sec

 Operation      Count    AvgLat    MaxLat
 ----------------------------------------
 NTCreateX     802662     0.048    17.724
 Close         589690     0.004    16.497
 Rename         33985     0.116     9.101
 Unlink        162038     0.091    15.332
 Deltree           24     6.856    16.382
 Mkdir             12     0.009     0.011
 Qpathinfo     727482     0.019    22.614
 Qfileinfo     127620     0.004     6.401
 Qfsinfo       133391     0.006     5.409
 Sfileinfo      65387     0.038     6.559
 Find          281296     0.062    14.127
 WriteX        400886     0.054    14.518
 ReadX        1258013     0.008    15.853
 LockX           2614     0.009     2.004
 UnlockX         2614     0.002     0.056
 Flush          56269     1.681    30.567

Throughput 420.743 MB/sec  4 clients  4 procs  max_latency=30.604 ms
OpenEBS Hostpath
root@ubuntu-pv:/mnt# dbench 4 -t 60
dbench version 4.00 - Copyright Andrew Tridgell 1999-2004

Running for 60 seconds with load '/usr/share/dbench/client.txt' and minimum warmup 12 secs
failed to create barrier semaphore
2 of 4 processes prepared for launch   0 sec
4 of 4 processes prepared for launch   0 sec
releasing clients
   4     19417   485.07 MB/sec  warmup   1 sec  latency 61.932 ms
   ...
   4   1509830   461.45 MB/sec  execute  59 sec  latency 8.779 ms
   4  cleanup  60 sec
   0  cleanup  60 sec

 Operation      Count    AvgLat    MaxLat
 ----------------------------------------
 NTCreateX     881476     0.036    18.982
 Close         647542     0.003     3.237
 Rename         37322     0.091     6.312
 Unlink        178011     0.080    25.554
 Deltree           24     7.071    17.884
 Mkdir             12     0.031     0.257
 Qpathinfo     798973     0.015     7.526
 Qfileinfo     140070     0.003     3.674
 Qfsinfo       146492     0.005     3.453
 Sfileinfo      71812     0.034     7.035
 Find          308908     0.050     9.243
 WriteX        439811     0.050    14.526
 ReadX        1381540     0.007    10.346
 LockX           2870     0.007     0.142
 UnlockX         2870     0.002     0.134
 Flush          61789     1.713    36.412

Throughput 461.453 MB/sec  4 clients  4 procs  max_latency=36.419 ms
OpenEBS Jiva with 2 replicas
# OpenEBS jiva replicas 2
root@ubuntu-pv:/mnt# dbench 4 -t 60 -D .
dbench version 4.00 - Copyright Andrew Tridgell 1999-2004

Running for 60 seconds with load '/usr/share/dbench/client.txt' and minimum warmup 12 secs
failed to create barrier semaphore
2 of 4 processes prepared for launch   0 sec
4 of 4 processes prepared for launch   0 sec
releasing clients
   4      2768   127.85 MB/sec  warmup   1 sec  latency 93.328 ms
   ...
   4    266123    80.68 MB/sec  execute  59 sec  latency 39.204 ms
   4  cleanup  60 sec
   0  cleanup  60 sec

 Operation      Count    AvgLat    MaxLat
 ----------------------------------------
 NTCreateX     155431     0.049    16.076
 Close         114022     0.003     1.976
 Rename          6585     0.223   208.945
 Unlink         31511     0.166   270.713
 Qpathinfo     140900     0.019    10.168
 Qfileinfo      24536     0.003     0.763
 Qfsinfo        25894     0.006     0.919
 Sfileinfo      12628     0.444   172.154
 Find           54493     0.053    11.917
 WriteX         76741     0.139   170.022
 ReadX         244006     0.012   208.132
 LockX            508     0.009     0.225
 UnlockX          508     0.002     0.009
 Flush          10897    18.041   578.899

 Throughput 80.6754 MB/sec  4 clients  4 procs  max_latency=578.915 ms
OpenEBS jiva replicas 3
root@ubuntu-pv:/mnt# dbench 4 -t 60 -D /mnt
dbench version 4.00 - Copyright Andrew Tridgell 1999-2004

Running for 60 seconds with load '/usr/share/dbench/client.txt' and minimum warmup 12 secs
failed to create barrier semaphore
0 of 4 processes prepared for launch   0 sec
4 of 4 processes prepared for launch   0 sec
releasing clients
   4      2661   122.86 MB/sec  warmup   1 sec  latency 38.586 ms
   ...
   4    203002    61.26 MB/sec  execute  59 sec  latency 45.737 ms
   4  cleanup  60 sec
   0  cleanup  60 sec

 Operation      Count    AvgLat    MaxLat
 ----------------------------------------
 NTCreateX     118397     0.050    85.560
 Close          86833     0.003     3.209
 Rename          5013     0.323   357.716
 Unlink         24013     0.208   259.184
 Qpathinfo     107327     0.022   135.383
 Qfileinfo      18676     0.003     0.414
 Qfsinfo        19727     0.006     0.470
 Sfileinfo       9615     0.630   290.763
 Find           41489     0.053     8.377
 WriteX         58441     0.167   260.539
 ReadX         185590     0.011    23.028
 LockX            386     0.007     0.034
 UnlockX          386     0.002     0.018
 Flush           8298    24.295   710.696

Throughput 61.2597 MB/sec  4 clients  4 procs  max_latency=710.717 ms

```bash
# OpenEBS jiva replicas 2
# Cstore replicas 2
root@ubuntu-pv:/mnt# dbench 4 -t 60 -D /mnt
dbench version 4.00 - Copyright Andrew Tridgell 1999-2004

Running for 60 seconds with load '/usr/share/dbench/client.txt' and minimum warmup 12 secs
2 of 4 processes prepared for launch   0 sec
4 of 4 processes prepared for launch   0 sec
releasing clients
   4      1884   105.47 MB/sec  warmup   1 sec  latency 72.575 ms
   ...
   4    167654    50.56 MB/sec  execute  59 sec  latency 121.113 ms
   4  cleanup  60 sec
   0  cleanup  60 sec

 Operation      Count    AvgLat    MaxLat
 ----------------------------------------
 NTCreateX      98068     0.048    29.423
 Close          71998     0.004     1.113
 Rename          4158     0.186     8.397
 Unlink         19830     0.181    16.361
 Qpathinfo      88996     0.026    15.805
 Qfileinfo      15512     0.004     0.589
 Qfsinfo        16306     0.007     0.779
 Sfileinfo       7982     0.819   504.358
 Find           34375     0.062     8.533
 WriteX         48452     0.180   186.603
 ReadX         153880     0.017   257.168
 LockX            320     0.008     0.054
 UnlockX          320     0.003     0.007
 Flush           6860    29.957  1134.001

Throughput 50.5629 MB/sec  4 clients  4 procs  max_latency=1134.019 ms